
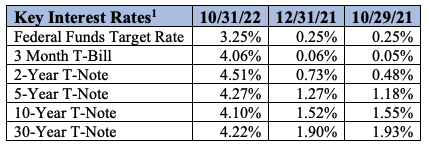
The Economy
As we put together this month’s newsletter, the Federal Reserve (the “Fed”) has just announced an additional 75 basis point hike in interest rates. This makes the number on the left, 3.25%, incorrect as it is now at 4.00%. This is the fourth such increase of 0.75%, the sixth rate hike this year, and comes as the battle against inflation continues. Federal Reserve Chairman Jerome Powell stated that further increases are on the horizon, but of a smaller nature until inflation reaches their 2% target. For perspective, the September reading showed inflation running at an 8.2% annual rate, the highest in four decades. On the positive front regarding our economy, the first estimate of our third quarter Gross Domestic Product (GDP – the primary measurement of all goods and services produced in the U.S.) was reported at a 2.6% growth rate – this after two straight quarters of negative GDP growth. This report beat estimates, which projected a 2.3% growth rate. A narrowing trade deficit and increases in consumer spending and government outlays helped, yet the pullback in housing subtracted from the number, part of a broader decline in private investment. Consumer spending decelerated, increasing at just a 1.4% pace in the quarter, down from 2% in Q2 – a key metric as consumer spending accounts for about two-thirds of our economy. Other uplifting news was the unemployment rate, which is still at an extremely low rate of 3.7% according to the Labor Department’s October Jobs Report, with 261,000 new jobs added, beating expectations. Regardless, inflation, supply chain restraints, higher interest rates, and a strong dollar, to name just a few items, pose major challenges for our economic growth.2
The Markets
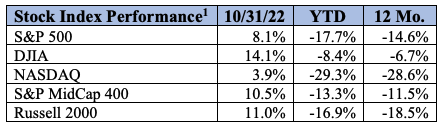
For the month of October, the news has been bullish on the stock market front. The S&P 500, our preferred benchmark, was up 8.1% for the month, but still about 19% below its all-time high and down 17.7% year-to-date. The S&P MidCap 400 and the small cap Russell 2000 also posted positive total returns, coming in at 10.5% and 11.0%, respectively, exceeding the returns on the S&P bellwether and the more volatile NASDAQ. The NASDAQ Composite gained 3.9%. Laden with more volatile companies, especially in the technology area, it was still encouraging to see positive numbers here as this index is still down 29% year-to-date. The most well-known market measure is of course the Dow Jones Industrial Average (DJIA). In October, the DJIA posted a total return of 14.1%. All five of these indices are still in bear market territory, which is defined as a price drop of 20% or more from the most recent peak price of a security or index and can only be exited with returns of 20% plus from the bottom to signal a new bull market. To get an idea of the strength of the market, all 11 of the major sectors that comprise the S&P 500 index posted gains in October. Energy was once again the top performer, up almost 25% and the Communications Services sector was still the laggard in last place but did post a positive return of 0.14%. Energy still leads year-to-date, up 68.1%, and Communication Services, again in last, down 39% for the year. 3
Outlook
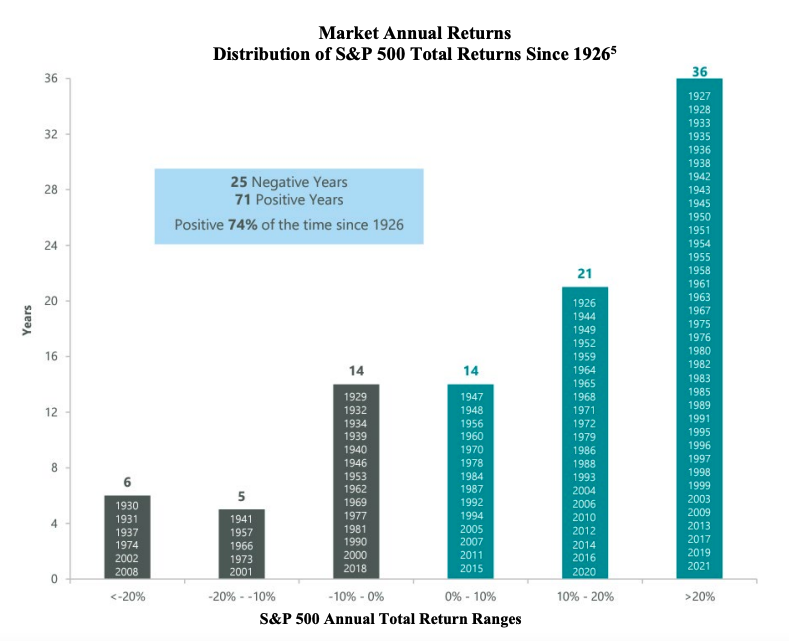
Whether you are invested in stocks, bonds, or a combination, your portfolio has likely declined in value this year. You are not alone, and this brings us to a rare statistic recorded by our markets this year: only five times since 1928 have both the S&P 500 index and the US 10-Year Treasury Bond experienced negative total returns (price plus dividends and interest). And while this year is one, it is an outlier even among these rare occurrences, as both measures have experienced double-digit negative returns, something that has never occurred going back almost a century. What does this mean? From our perspective, not only do you stay the course and stick with your strategy, but also that investments in either stocks or bonds represent an even greater value than normal. As shown in the chart below, the market has had only 25 negative years since 1926. This gives us 71 positive years, meaning calendar returns have been positive 74% of the time through 2021. The lesson learned is that perseverance pays off for the patient investor.4
S&P 500
So, what concerns are there? They are several, including inflation, the decline in real wages, rising interest rates, Federal Reserve intervention, the strengthening dollar (pros and cons), global contraction, geopolitical issues – China, Russia, Ukraine, Taiwan, Afghanistan, and even domestic politics such as the mid-term elections. But most of these items we list every month, as geopolitical and economic concerns never dissipate.
The positives include:
- Third quarter earnings season: Over half of the S&P 500 companies have reported, with almost 70% exceeding Wall Street’s estimates for sales and profits
- Stock buybacks: U.S. companies have announced stock buybacks totaling $1 trillion so far in 2022, up 8% from a year ago and on course for a record annual high
- Low valuations (Price to Earnings Ratios, P/E Ratios): Both forward and trailing P/E’s have fallen from overvalued areas
- Low stock and bond prices: Investment opportunities
- The stock market is a leading indicator: Hence, the market has mostly likely signaled a recession, and typically turns positive well before a recession ends
- Our American Companies: Excellent leadership, workers, and innovation
- American consumers: Healthy balance sheets
- Unemployment: At 40-year lows6
There are of course other positives, but for brevity we have listed several we think are the most important. US capital markets in the long term have historically been rewarding, hence our optimism. Please call us any time if you want to discuss any of this information in further detail. Thank you again for your support and we will talk soon.
“You make most of your money in a bear market, you just don’t realize it at the time.” -Shelby Cullom Davis7
- Sources: YCharts.com; total returns
- Source: First Trust Portfolios L.P., CNBC.com
- Source: Standard & Poor’s, First Trust Portfolios, L.P.
- Sources: Charlie Bilello (as of 10/14/22), ClearBridge Investments (as of 12/31/21)
- Sources: Charlie Bilello (as of 10/14/22), ClearBridge Investments (as of 12/31/21)Source: First Trust Portfolios, L.P.
- Source: First Trust Portfolios, L.P.
- Source: DavisFunds.com
DISCLOSURE: Past performance is no guarantee of future results. Inherent in any investment is the potential for loss.
Zacks Investment Management, Inc. is a wholly-owned subsidiary of Zacks Investment Research. Zacks Investment Management is an independent Registered Investment Advisory firm and acts as an investment manager for individuals and institutions. Zacks Investment Research is a provider of earnings data and other financial data to institutions and to individuals.
This material is being provided for informational purposes only and nothing herein constitutes investment, legal, accounting or tax advice, or a recommendation to buy, sell or hold a security. Do not act or rely upon the information and advice given in this publication without seeking the services of competent and professional legal, tax, or accounting counsel. Publication and distribution of this article is not intended to create, and the information contained herein does not constitute, an attorney-client relationship. No recommendation or advice is being given as to whether any investment or strategy is suitable for a particular investor. It should not be assumed that any investments in securities, companies, sectors or markets identified and described were or will be profitable. All information is current as of the date of herein and is subject to change without notice. Any views or opinions expressed may not reflect those of the firm as a whole.